RSS

Monthly Archives: November 2018

Guidelines for Measuring the ROI Impact of Inclusion

ROI Graphic 4

“Inclusion” is Big Business

Workforce Diversity and Inclusion is a concept that appears to have taken hold in companies worldwide. According to a survey conducted by SHRM, 55% of respondents say their organizations “strongly promote” Diversity and Inclusion. However, the interpretations of the phrase and the methods used to achieve and measure this goal vary widely among companies and regions. In companies with the most successful Diversity programs, the impetus and tone emanate from the most senior ranks of the organization. According to SHRM, sixty percent of respondents to the survey say the main advocates for Diversity and Inclusion in their organizations are the CEO and top management, followed by heads of HR (42%). Most companies recognize that “Diversity” and “Inclusion” are closely linked; Inclusion helps to ensure that employees from diverse backgrounds are able to contribute, remain with the company and flourish (SHRM Report: Global Diversity and Inclusion: Perceptions, Practices and Attitudes).

These facts notwithstanding, how can a diversity executive report to the CEO or Board of Directors that the organization is now 5 percent more inclusive than the year before and quantify what effect that statement has on the bottom line? In the absence of direct measures, it’s often necessary to rely on indirect observations to determine if goals are being achieved. Key Performance Indicators (KPI’s) such as engagement scores, retention rates, productivity measures and diversity representation at various tiers often must be combined as an “Index value” to create a broader picture of an inclusion strategy’s impact on the overall organizational culture.
ROI Graphic 3

Creating Evidence-based Measures

I recommend that in order to effectively create an “evidence-based” measure of “inclusion”, a multi-faceted approach must be used. There are several prerequisites:

To measure inclusion, diversity executives should:

1) Review their current definition of Inclusion and drivers behind the organization’s inclusion initiative to make sure they describe the desired cultural effect as well as the employee behaviors expected to achieve the desired results. Establishing a behaviorally-specific definition for inclusion that spells out measurable elements and is understood across the entire organization can maintain focus and help develop analytics that influence organizational performance.

2) Align the organization’s inclusion definition and drivers with strategic organizational goals. If the organization needs to improve its talent pipeline, weave inclusion initiatives into existing talent management functions. If increasing innovation is critical, promote inclusion programs that will facilitate knowledge sharing. Both of these goals may require raising awareness of the employment brand by competing to become an employer of choice.

3) As organizational goals help to develop drivers, and drivers help to develop programs to support those goals, be sure to evaluate the business and Diversity ROI impact to ensure programs are having an effect. Select or develop metrics that circle back to align with the original drivers. By carefully articulating outcomes, organizations can define measures that assess the impact of their inclusion strategy. For a concept as ephemeral as inclusion, multiple qualitative, quantitative, effectiveness and efficiency metrics may be required to imply success or indicate the need for a course change.

Sample Inclusion Items

Here are a few sample items from one of our Hubbard & Hubbard, Inc. Inclusion surveys that reflect these ideas:
1. I can be fully myself around here without having to compromise or hide any part of who I am.
2. In a group, I am able to be fully part of the whole while retaining a sense of authenticity and uniqueness which reflects who I am.
3. Different views and opinions are valued in decision-making.
4. It is generally safe to say what you think.
5. I feel safe, trusted, accepted, respected, supported, valued, fulfilled, engaged, and can be authentic in my working environment

Use Even-numbered Response Scales

I have found it helpful to use an “even numbered” response scale that encourages the respondent to determine if this item ‘is’ or ‘is not’ true for them rather than somewhere in the middle. You can use “even numbered” scales such as:

  1. Strongly Disagree
  2. Disagree
  3. Mildly Disagree
  4. Mildly Agree
  5. Agree
  6. Strongly Agree

This also guides you towards a more definitive action plan that is firmly rooted in addressing specific problems and opportunities.

Inclusion Definitions Must be Behaviorally Specific

In order to measure the ROI of Inclusion, the definition of Inclusion that is used must be crafted in behaviorally-specific terms that are measurable. This aligns your work to show the “chain-of-impact” that links the change to your initiative’s outcomes. Here are a few examples of Inclusion definitions that imply a measurement connection:

I define Inclusiveness this way… (I have separated elements of the definition such that you can see some of the measurable components):

  • “Inclusiveness is the act or process of utilizing the information, tools, skills, insights, and other talents that each individual has to offer which results in the measurable, mutual benefit (and gain) of everyone.
  • It also includes providing everyone with opportunities to contribute their thoughts, ideas, and concerns.
  • Inclusiveness results in people feeling valued and respected.”

Wikipedia defines Inclusion as: “practice of insuring that people in organizations feel they belong”. Thus, in order to measure the impact of inclusion you must begin by defining what it means to “belong” in behaviorally specific terms.

Miller and Katz (2002) present a common definition of an inclusive value system where they say, “Inclusion is a sense of belonging: feeling respected, valued for who you are; feeling a level of supportive energy and commitment from others so that you can do your best work.”  (Book: “The Inclusion Breakthrough” by Frederick Miller and Dr. Judith Katz)

Another definition from Wikipedia discusses Inclusion, when applied, it creates

  • A shift in organization culture. The process of inclusion engages each individual and makes ‘people feeling valued’ essential to the success of the organization.
  • Individuals function at full capacity, feel more valued, and included in the organization’s mission. This culture shift creates higher performing organizations where motivation and morale soar.

From a measurement point of view, using this Wikipedia definition would require metrics and processes that track and evaluate shifts in organizational culture, engagement, individual perceptions of value, levels of individual functioning, etc.

These few examples highlight some of the requirement to accurately start to report the ROI of Inclusion. It will require strict adherence to a Diversity ROI measurement process and framework that demonstrates a “chain-of-impact” or “chain-of-evidence” that clearly shows that the Inclusion intervention or initiative was a major source of the calculated ROI impact.

In future Blogs, I will further discuss measuring the ROI impact of Inclusion. In addition; let me know what you think about this approach. If you have other guidelines that have been beneficial in your experience, tell us. We will share your examples such that others can learn and grow.

Dr. Ed Hubbard is an expert in Organizational Behavior, Organizational Analysis, Applied Performance Improvement and Measurement Strategies, Strategic Planning, Diversity Measurement, and Organizational Change Methodologies. Dr. Hubbard earned Bachelors and Masters Degrees from The Ohio State University and earned a Ph.D. with Honors in Business Administration. Dr. Hubbard is available for presentations, conferences, training, consulting and can be reached at edhub@aol.com or 707-481-2268.



Tags: , , , , , , , , , , , , , , ,

A Next Level Approach to “Evolve Your Diversity Scorecard”​

de_1209_diversitybythenumbers_blog_v1_680x300jpg

How well does your existing Diversity measure(s) capture “strategic organizational drivers” that make a measurable difference in bottom-line organizational performance? For most organizations there will not be a very close match between the two lists. Even more important, in those firms where Diversity professionals think there is a close match, frequently, the senior executives do not agree that this second list actually describes how Diversity creates value. In either case, there is a serious disconnect between what is measured, what is important to organizational performance.

These questions are fundamental because new economic realities are putting pressure on Diversity to widen its focus from the traditional role of guardian of ethnic representation, social justice, and well-being to a broader, more strategic role as an important strategic business partner. As a primary source of production and performance impact, our economy has shifted from physical to intellectual capital (which comes in all diversity mixtures such as colors, backgrounds, genders, orientations, thinking styles, etc.). A good idea does not have a specific color, race, creed, gender, sexual orientation or physical ability. It’s just a great ideas and it can come from anyone! As a result, senior Diversity executives and managers are increasingly coming under fire to demonstrate exactly how they are helping the organization “organize, utilize, and support” this critically significant organizational asset to create improved performance and value.

Performance measurement in organizations is not something new, however, in the last 30 years or so, organizations have realized that financial measures alone are not sufficient for evaluating the success of an enterprise.

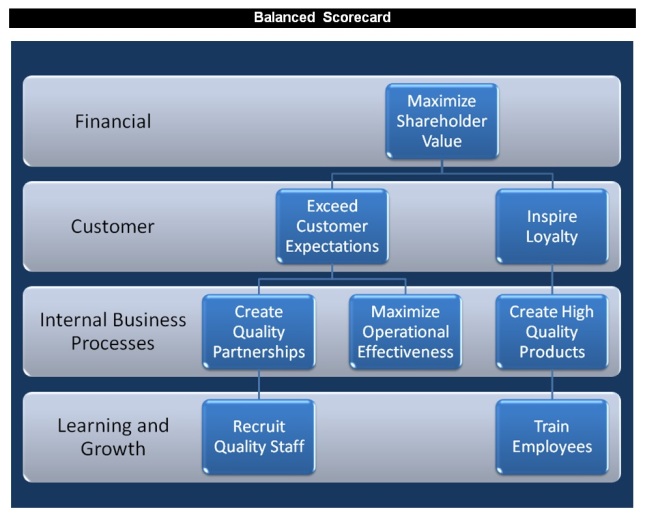
In the mid-1990s, the balanced scorecard concept was introduced; forcing executives to take a hard look at how many of their metrics were financial and then balance out their scorecards with non-financial metrics. The balanced scorecard approach also recommended that fewer metrics are better. The number of metrics that companies tracked had been increasing each year for many years, but Kaplan and Norton suggested that no one should have more than 15 to 20 metrics per scorecard. This is still a tough sell for analytical executives who love pouring over hundreds of charts each month.

The primary issue that Diversity must deal with is very hard for some to imagine and believe, that is, showing Diversity’s measurable impact on organizational strategy and the financial bottom-line. The ability to utilize a diverse mix of human and other resources to create unique blend of strategy focused solutions, by its very nature, creates an innovative competitive process that is difficult to copy – thus making it a competitive advantage (largely invisible to competitors).


Evolving the Diversity Scorecard’s Business Impact

 Balanced Scorecard Image

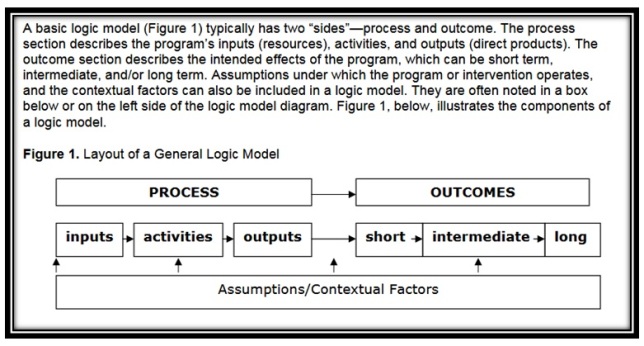
Current Diversity Scorecards must evolve to move beyond simply counting heads. They must elevate their utility to a level that utilizes “Logic Model-based predictive analytics and processes which more accurately generate “Strategic Outcomes” and “Intended Transformational Impacts.

What are Analytics

Analytics come in different types with a specific focus. They can be defined as follows:

·        “Analytics” is the Science of Analysis

·        “Descriptive Analytics” tells what has happened in the past and usually the cause of the outcome.

·        “Predictive Analytics” focuses on the future telling what is likely to happen given a stated approach.

·        “Prescriptive Analytics” tells us what is the ‘Best’ course of action.


Descriptive Diversity Analytics can help us understand human capital challenges and opportunities in utilizing a diverse workforce. Whereas Predictive Diversity Analytics, helps us identify investment value and a means to improve future outcomes from Diversity interventions and initiatives.

Although most organizations have come a long way in introducing better metrics for Diversity on their corporate scorecards, there is still a great deal of work to be done. Even the best scorecards need improvement in some key areas to evolve to the next level of performance impact. Metrics on several Diversity Scorecards focus on counting activities, not producing outcomes and organizational transformations. There is a distinct difference between generating “outputs” from scorecard action plans and producing “Strategic Outcomes” and “Intended Transformational Impacts”. I define “Strategic Outcomes” and “Intended Transformational Impacts as “the planned, intended measurable result or effect of an action, situation, or event; something that follows due to a planned execution of actions which result in intended consequence (or unintended consequences) that add value and drives change.

My new book: “Evolving Your Diversity Scorecard. Maximizing Diversity Business Intelligence with Transformational Analytics” will help develop a Strategic Outcomes Scorecard using Diversity Transformational Analytics® to drive organizational change and “next level” impacts (based upon a “Logic Model” framework).

HH Logic Model Example

Logic models are extremely effective tools for planning, describing, managing, communicating, and evaluating a program or intervention. They graphically represent the relationships between a program’s activities and its intended effects, state the assumptions that underlie expectations that a program will work, and frame the context in which the program operates. Logic models are not static documents. In fact they should be revised periodically to reflect new evidence, lessons learned, and changes in context, resources, activities, or expectations. Our system and approach to Logic models increase the likelihood that a Diversity and Inclusion intervention effort will be successful because they:

• Communicate the purpose of the program and expected results.

• Describe the actions expected to lead to the desired results.

• Become a reference point for everyone involved in the program.

• Improve program staff expertise in planning, implementation, and evaluation.

• Involve stakeholders, enhancing the likelihood of resource commitment.

• Incorporate findings from other research and ROI-based initiatives.

• Identify potential obstacles to program operation so that staff can address them early on.


Evolving the Diversity Scorecard requires that we ask key strategic measurement questions and perform specific actions along the Logic Model path to create transformational outcomes, impact and change. This is not a generic, random process. It involves possessing specific Transformational Analytics knowledge, skills and competencies to correctly drive each outcome phase (Initial, Intermediate, and Long-term) to achieve the desired change effect and impact. To gain the tremendous benefits that Diversity and Inclusion offers, our Scorecards and other measurement tools must take full advantage of “next level” practices such as the Hubbard Diversity Measurement Sciences and Analytics® to ensure better predictive accuracy to deliver strategic Diversity outcomes and transformational impacts. These methods provide the knowledge, skills, competencies, and tools to achieve excellence in implementing these paradigm shifting processes. As Diversity professionals, our utility, organizational value, brand reputation, credibility, and success will depend on our capability to demonstrate critical evidence-based impacts of Diversity initiative success. To this end, our Diversity scorecards must keep pace to display, track, and manage these results. Let me know what you think. Dr. Ed.

This article is based upon excerpts from the upcoming book: “Evolving Your Diversity Scorecard”: Maximizing the Use of Transformational Analytics to Drive Organizational Performance by Dr. Edward E. Hubbard, Ph.D. It is scheduled for release Spring 2019. Dr. Ed Hubbard can be reached at edhub@aol.com.

Dr. Ed Hubbard is an expert in Organizational Behavior, Organizational Analysis, Applied Performance Improvement and Measurement Strategies, Strategic Planning, Diversity Measurement, and Organizational Change Methodologies. Dr. Hubbard earned Bachelors and Masters Degrees from The Ohio State University and earned a Ph.D. with Honors in Business Administration. Dr. Hubbard is available for presentations and consulting and can be reached at edhub@aol.com or 707-481-2268.


Tags: , , , , , , , , ,